Is Your Store Flying Blind? Why You Need a Shopee Analytic Tool in 2026
If you’ve been selling on Shopee for more than a few months, you know the frustration. You find a winning product, optimize your listing, and sales start trickling in. Then, out of nowhere, a competitor pops up with the exact same item, undercuts you by 5%, and suddenly their sales volume explodes while yours flatlines.
In the early days of e-commerce, we called this "bad luck." Today, seasoned sellers know it’s not luck—it’s data.
The difference between a hobby seller and a top-tier brand usually comes down to one thing: visibility. You cannot defeat a competitor you don't understand. To scale effectively, you need to stop guessing and start using a robust Shopee analytic tool that digs into the granular history of every SKU.

The "Black Box" Problem
Most sellers operate in a "Black Box." You see the end result (a competitor has 10k sold), but you don't see the journey.
- Did they burn cash on ads to get that ranking?
- Was their conversion rate high because of a flash sale or organic demand?
- Is that product actually profitable at that price point?
Without these answers, you are just gambling with your inventory budget.

Peeking Behind the Curtain with Shopdora
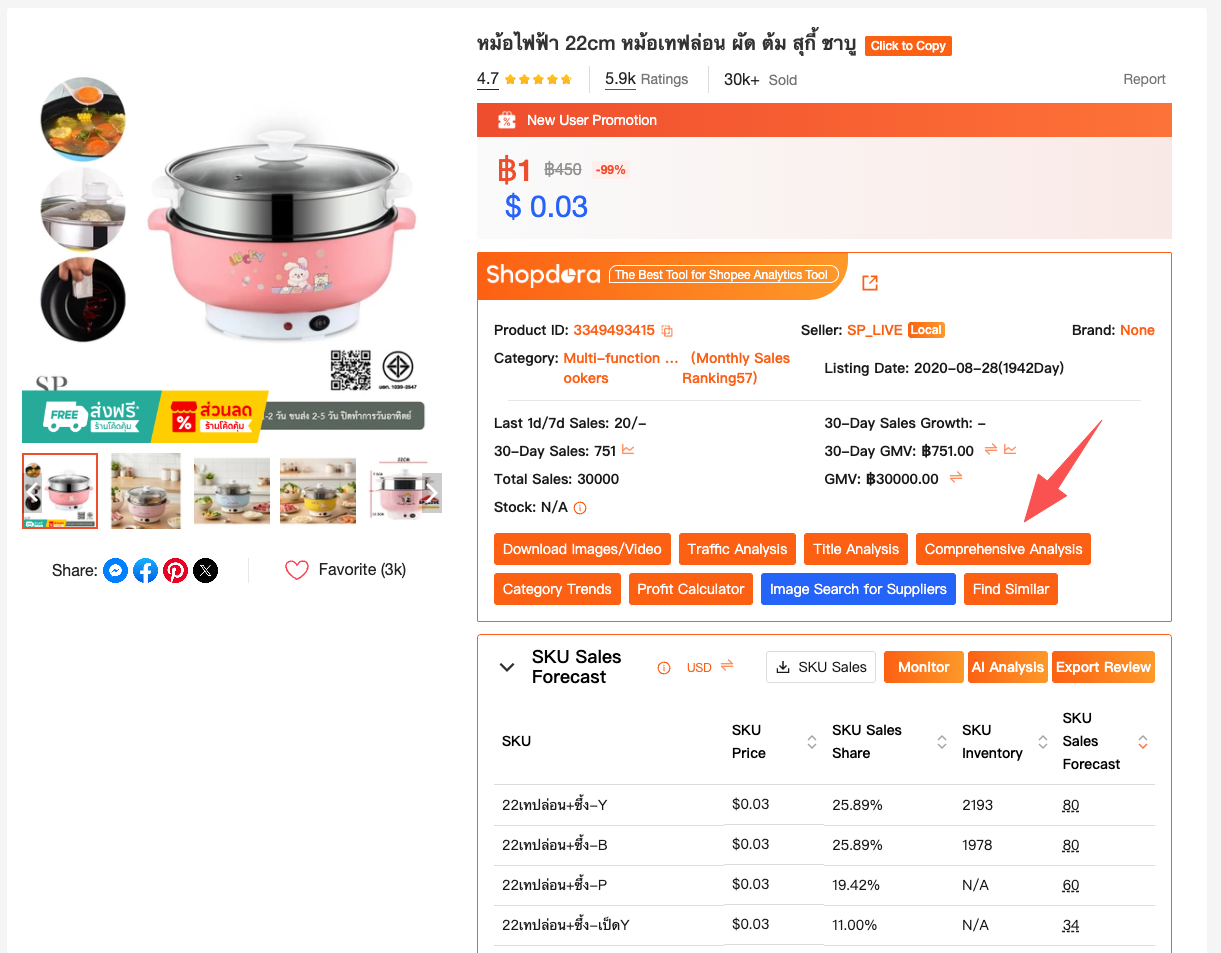
This is where your software stack matters. Recently, I’ve been digging into Shopdora, specifically using their "Comprehensive Analysis" feature.
What appeals to me here—and what separates a modern Shopee analytic tool from old-school scrapers—is the workflow. You don't need to leave the Shopee page. When you are looking at a competitor’s product on the front end, you just hit "Comprehensive Analysis," and it overlays the product's entire life cycle right there on the screen.
Let’s look at a real-world example to show you why this specific data is actionable.
1. The Correlation Between Sales Velocity and Ranking
Take a look at this trend chart I pulled for a household product. This isn't just a pretty graph; it’s a blueprint of how the Shopee algorithm works.
What the data actually tells us:
Look at the month of October (labeled 202510 on the axis).
- The Spike: There is a massive orange bar representing "Sold" units, and the blue "Sold Growth" line shoots up to nearly 600%. This was likely a Double Day campaign (10.10) or a heavy ad push.
- The Ranking Response: Now, look at the bottom chart (Ranking). As soon as that sales volume spiked, the Blue Line (Category Ranking) dropped significantly. Note: In ranking charts, a "drop" is good—it means moving closer to position #1.
The Strategy:
If this were my competitor, I now know their vulnerability. Look at December (202512). Their sales volume has normalized, and their ranking is slowly creeping back up (worsening) to position 60+. This signals "listing fatigue." If I were planning to launch a competing product, now is the time to attack, while their ranking is slipping.
2. Finding the "Golden Price"
Revenue isn't just about selling more; it's about selling at the right price. The "Comprehensive Trend" feature allows us to analyze pricing elasticity on a granular level.
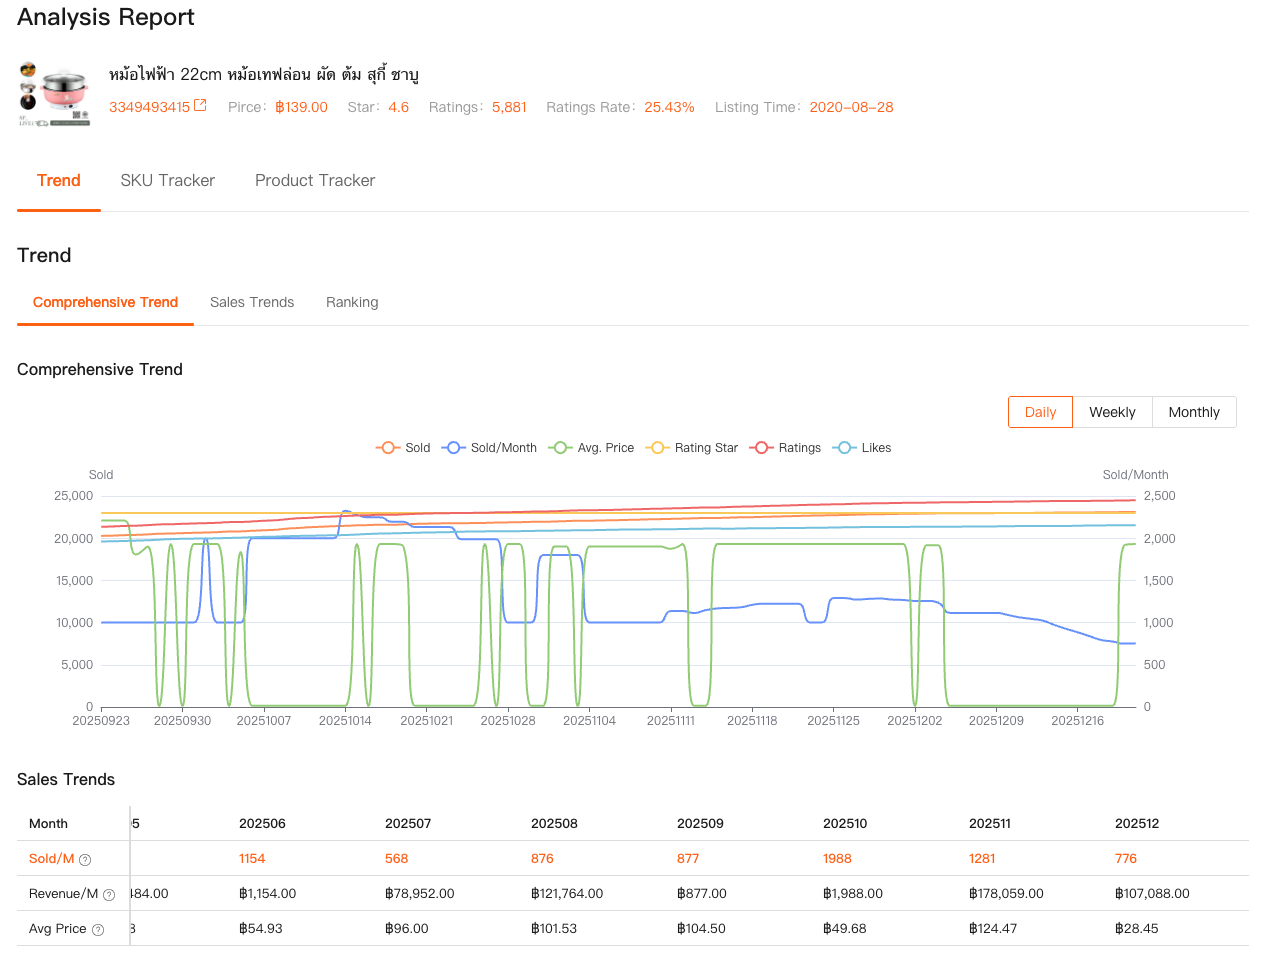
(Reference to the "Electric Pot" chart)
Here we are analyzing a 22cm Electric Pot. The chart overlays Avg. Price (Green Line) against Sold/Month (Blue Line).
Why this chart is a goldmine:
- Price Testing: You can see the green line fluctuating. This seller is actively testing different price points (ranging around ฿139 - ฿150).
- Volume vs. Margin: Notice that when the price stabilizes, the sales volume (blue line) finds a rhythm.
- Revenue Reality: By checking the data table below the chart, we see that in October (202510), they moved 1,988 units generating roughly ฿1,988 (likely a specific deal or data normalization), but in November (202511), they moved 1,281 units for ฿178,059.
This is the insight you need. It turns out, you don't need to sell 2,000 units to win. You might make more profit selling 1,200 units at a slightly higher price point. A good analytic tool saves you from the "race to the bottom."
Transforming Data into Profit
Having access to this data is great, but it’s useless if you don't act on it. Here is how you should incorporate this into your weekly routine:
- Validate Before You Source: Before you order 500 units from a supplier, run a Comprehensive Analysis on the top 3 competitors in that niche. Is the "Sold Growth" line trending up or down over the last 90 days? If the trend is dying, don't buy the stock.
- Spy on Pricing Changes: If a competitor suddenly drops their price, check their ranking graph 3 days later. Did it actually help them? If not, hold your price. Don't panic-discount just because they did.
- Identify Stock-Outs: When you see a competitor's ranking line crash (go up to 100+) and sales hit zero, they likely went out of stock. That is your window of opportunity to increase your ad spend and steal their market share.

Final Thoughts
The Shopee marketplace is becoming more sophisticated every year. The "listing and praying" method is dead.
To succeed in 2025, you need to treat your store like a data-driven business. Using a Shopee analytic tool like Shopdora doesn't just give you numbers; it gives you the confidence to make decisions. It allows you to see the market clearly, spot the gaps your competitors are leaving open, and capitalize on them.
Don't let your competitors have the unfair advantage. Check the data, find the trends, and rank higher.