2025 Brazil Shopee Market Product Selection Report

In-depth Analysis Based on Shopdora's Complete 2025 Data
Executive Summary
This report is based on complete data from Shopdora platform covering January to December 2025, providing in-depth analysis of Brazil Shopee site's market performance, category opportunities, pricing strategies, and seasonal patterns to support data-driven product selection decisions for cross-border sellers.
Key Findings:
- 📊 Annual GMV reached R$ 19.628 billion, market size continues to expand
- 🔥 December is the peak sales month, with monthly GMV of 2.659 billion, accounting for 13.5% of annual total
- 💎 Home & Living category dominates with 26.6% market share
- 📈 Beauty & Health grows fastest, with product growth rate of 54.95%
- 🎯 R$ 20-50 is the golden price range, with highest GMV share
01 Overall Market Overview
PART 1 2025 Brazil Site Core Data
Market Size and Growth
- Annual GMV: R$ 19.628 billion BRL
- Annual Order Volume: 549.55 million orders
- Average Order Value: R$ 35.71
From the annual data perspective, the Brazil site maintained strong growth momentum, with order volume exceeding 540 million, demonstrating tremendous market vitality and consumption potential. The average order value of R$ 35.71 indicates that Brazilian consumers prefer mid-range priced products, providing clear pricing strategy guidance for cross-border sellers.
Key Findings:
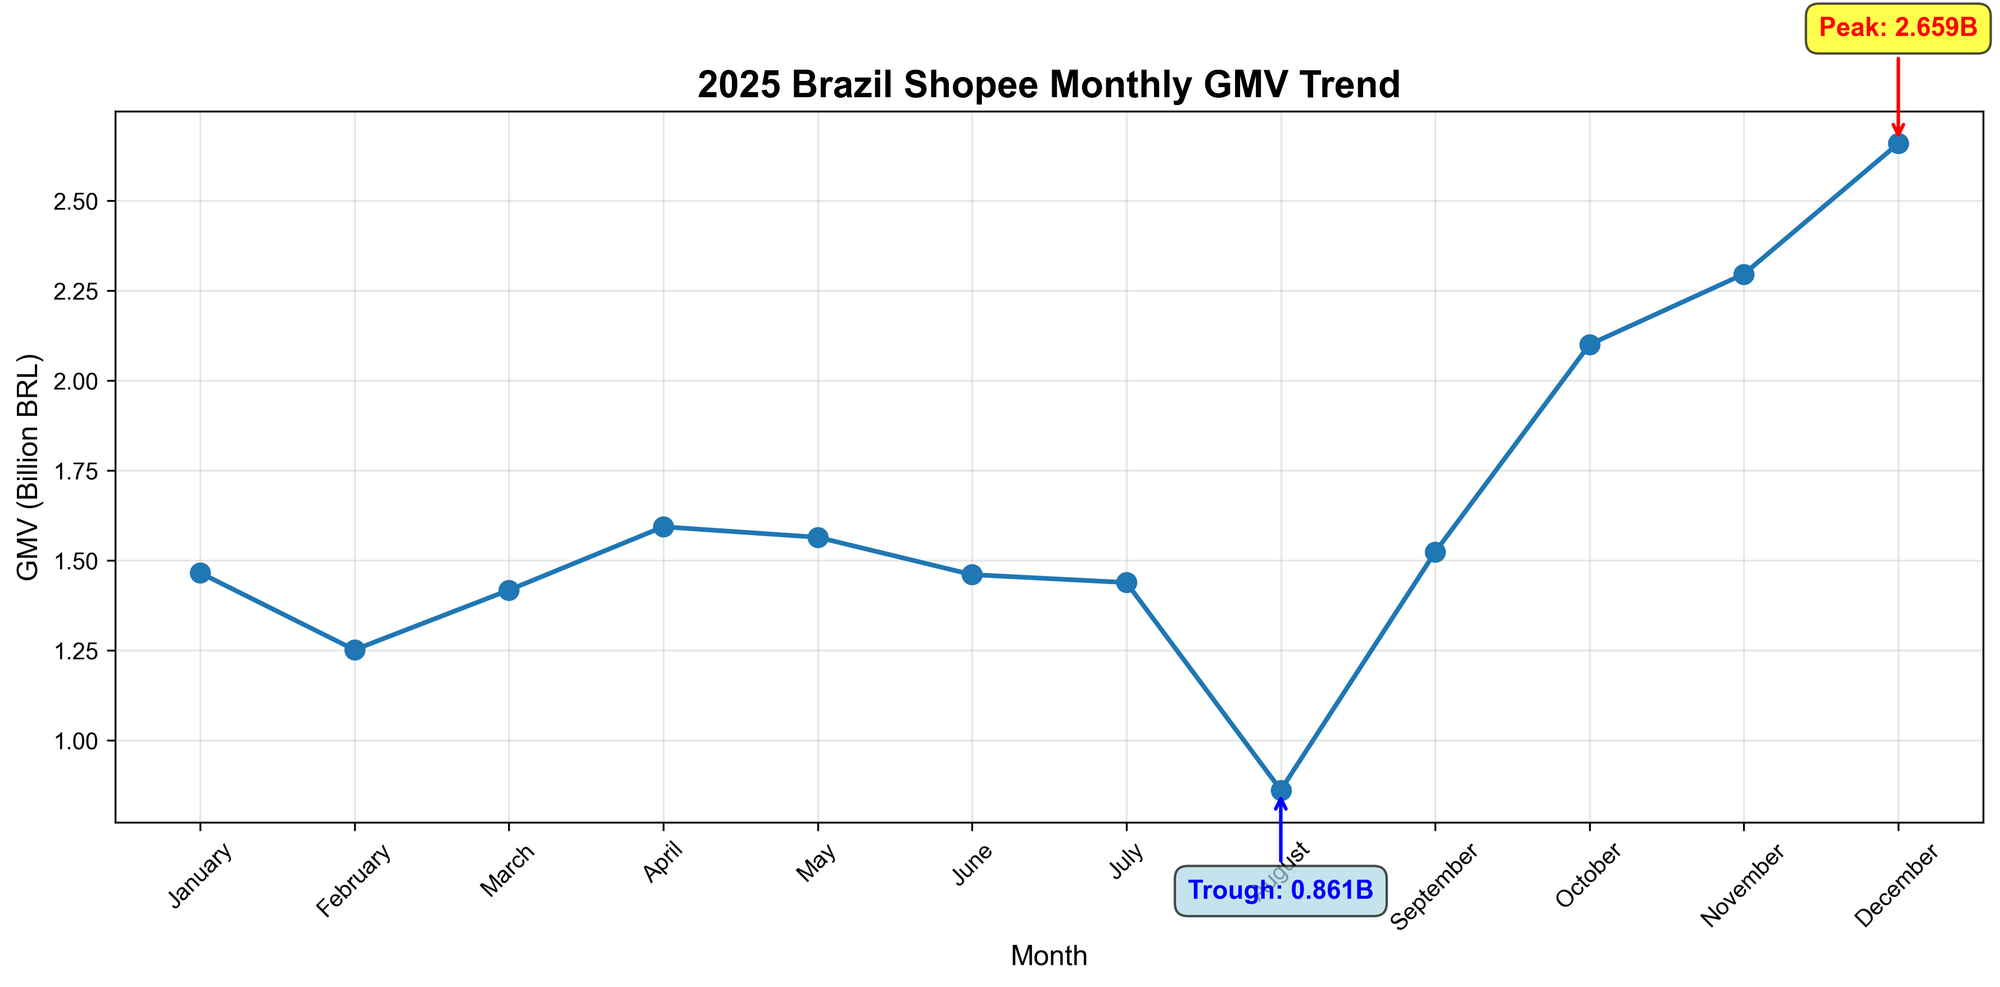
- 🔥 December is the annual peak sales month: GMV reached R$ 2.659 billion, accounting for 13.5% of annual total GMV, significantly influenced by Christmas and year-end promotions
- 📉 August is the sales trough: GMV only R$ 0.861 billion, down 40.1% MoM, seasonal factors need attention
- 📈 Q4 shows the strongest growth: GMV continued to grow from October to December, with 9.3% MoM growth in November and 15.8% in December, demonstrating the strong pull of year-end shopping season
PART 2 Monthly Sales Trend Analysis
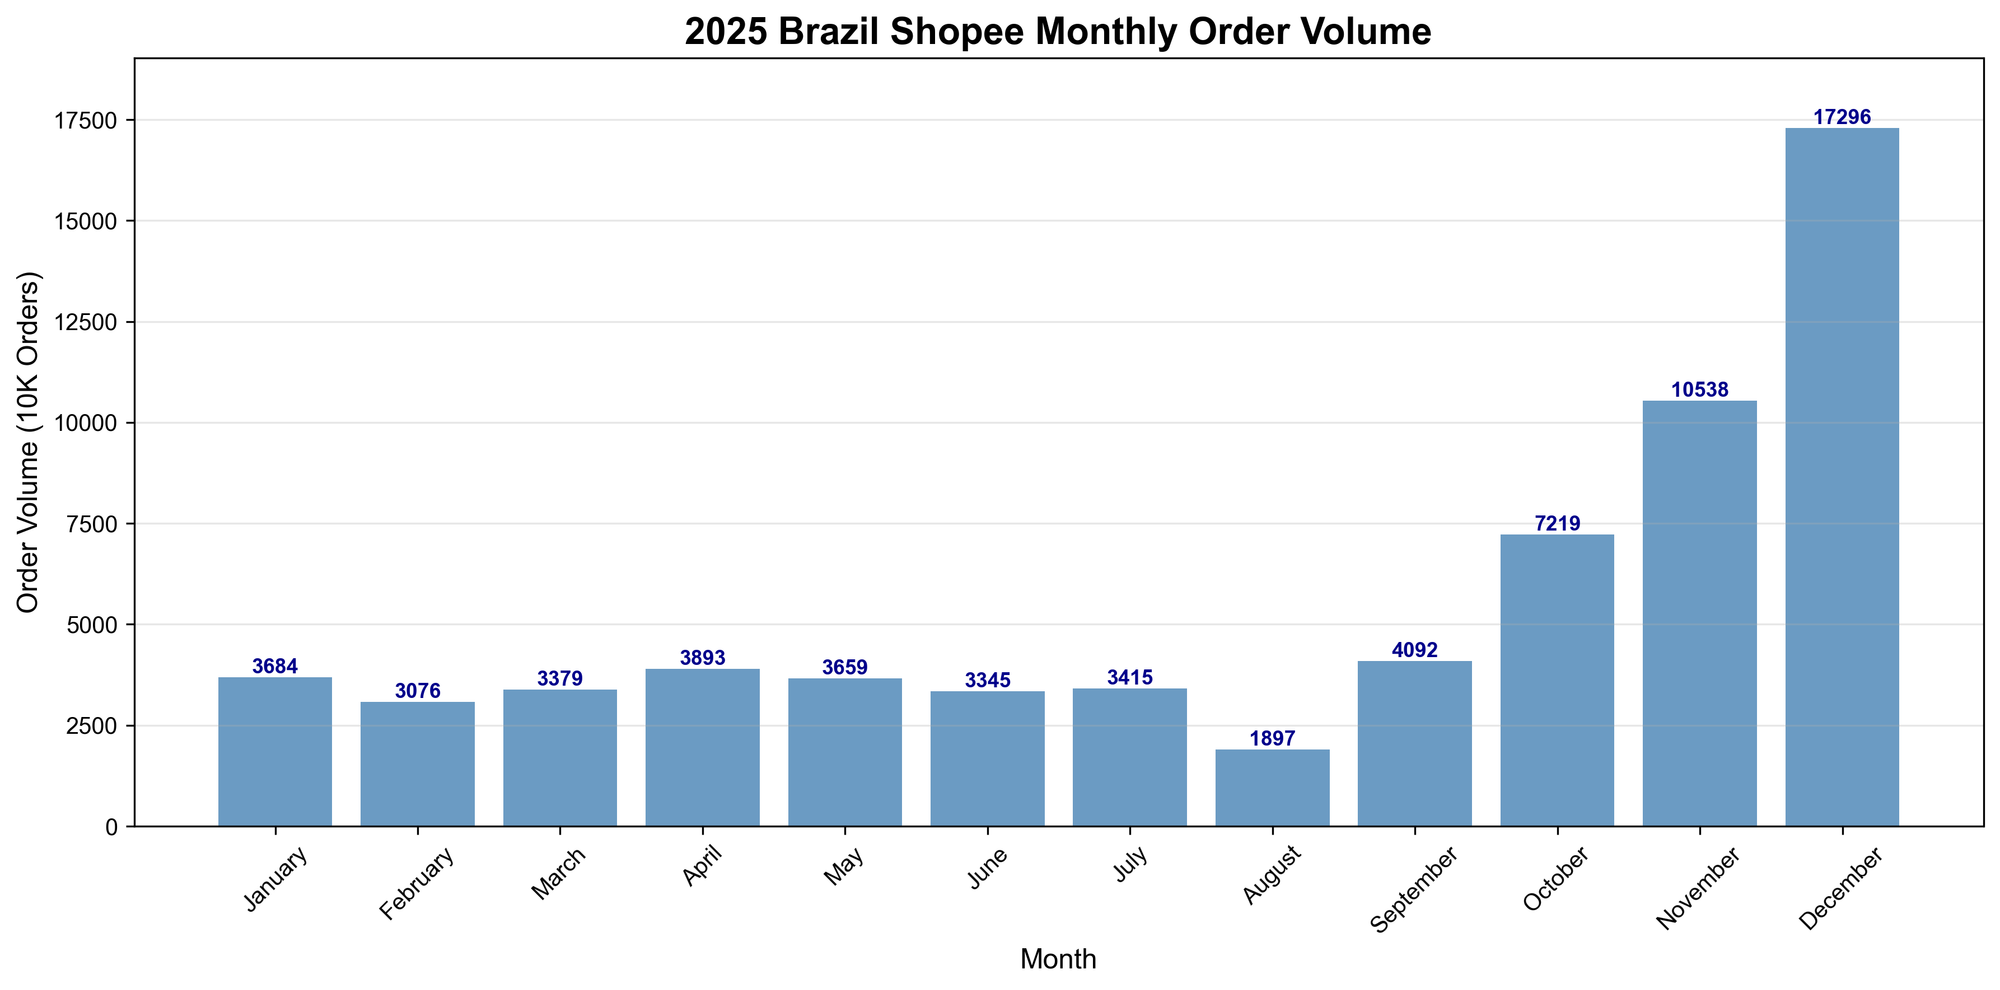
2025 Brazil Site Monthly Sales Data
| Month | GMV (Billion BRL) | MoM Growth | Order Volume (10K Orders) | AOV (R$) |
|---|---|---|---|---|
| Jan | 1.465 | - | 3,684 | 39.75 |
| Feb | 1.251 | -14.6% | 3,076 | 40.68 |
| Mar | 1.417 | +13.3% | 3,379 | 41.94 |
| Apr | 1.593 | +12.4% | 3,893 | 40.92 |
| May | 1.564 | -1.8% | 3,659 | 42.75 |
| Jun | 1.460 | -6.6% | 3,345 | 43.65 |
| Jul | 1.438 | -1.5% | 3,415 | 42.11 |
| Aug | 0.861 | -40.1% | 1,897 | 45.41 |
| Sep | 1.523 | +76.9% | 4,092 | 37.22 |
| Oct | 2.100 | +37.9% | 7,219 | 29.09 |
| Nov | 2.296 | +9.3% | 10,538 | 21.79 |
| Dec | 2.659 | +15.8% | 17,296 | 15.37 |
Seasonal Trend Insights:
- Q1 (Jan-Mar): Market relatively stable, average monthly GMV around 1.378 billion, influenced by New Year and Valentine's Day, with slight decline in February
- Q2 (Apr-Jun): Entering peak sales season, average monthly GMV reached 1.539 billion, 12.4% MoM growth in April showing Mother's Day and other holiday pull effects
- Q3 (Jul-Sep): Significant fluctuations appeared, August dropped sharply to 0.861 billion (-40.1%), but September rebounded strongly with 76.9% MoM growth
- Q4 (Oct-Dec): Strongest growth period of the year, November GMV reached 2.296 billion, December reached 2.659 billion, Black Friday and Christmas driving sales explosion
02 Category Market Analysis
PART 1 2025 Brazil Site Top 10 Category Sales Data
Overall Category Landscape
| Rank | Category | GMV (Billion BRL) | GMV Share | Sales Volume (10K Orders) | Average Price (R$) | Cross-border Seller Share |
|---|---|---|---|---|---|---|
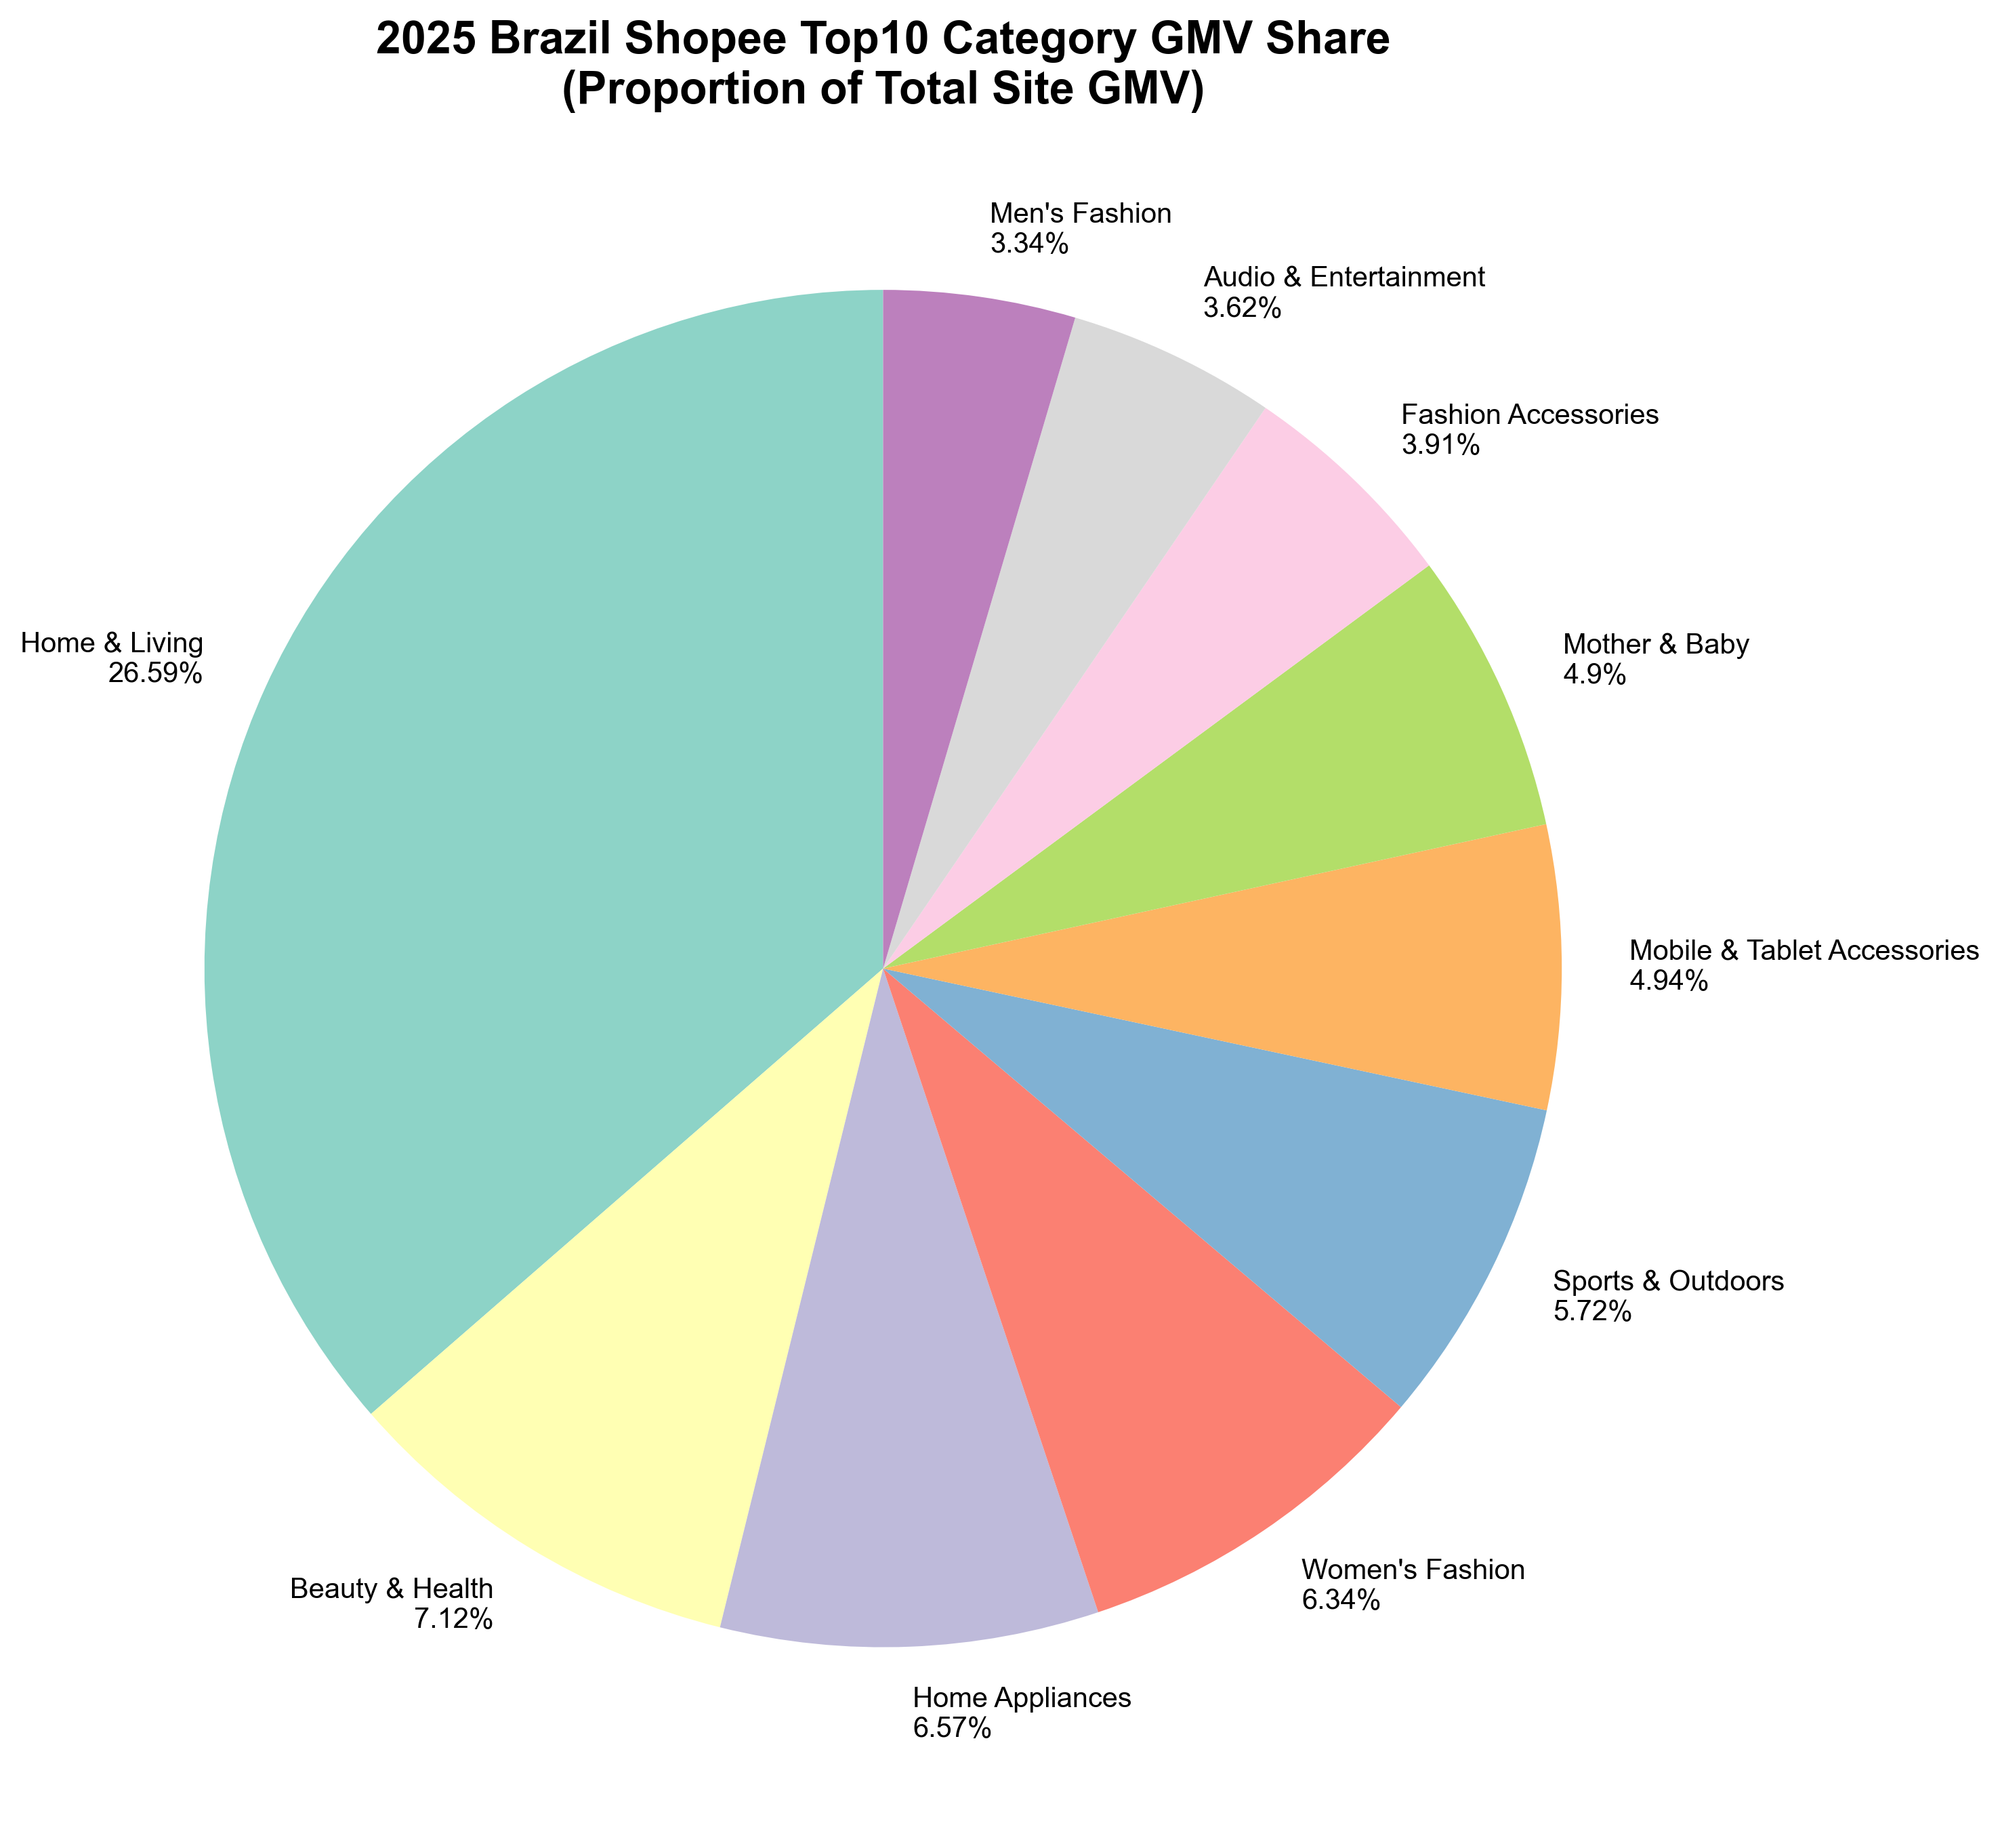
| 1 | Home & Living | 52.18 | 26.6% | 15,536 | 33.59 | 6.9% |
| 2 | Beauty & Health | 13.97 | 7.1% | 7,504 | 18.61 | 16.7% |
| 3 | Home Appliances | 12.90 | 6.6% | 1,728 | 74.66 | 4.2% |
| 4 | Women's Fashion | 12.45 | 6.3% | 3,053 | 40.77 | 7.8% |
| 5 | Sports & Outdoors | 11.23 | 5.7% | 2,690 | 41.77 | 14.4% |
| 6 | Mobile & Tablet Accessories | 9.70 | 4.9% | 1,666 | 58.21 | 19.3% |
| 7 | Mother & Baby | 9.62 | 4.9% | 2,258 | 42.60 | 12.6% |
| 8 | Fashion Accessories | 7.67 | 3.9% | 8,959 | 8.56 | 17.2% |
| 9 | Audio & Entertainment | 7.11 | 3.6% | 2,133 | 33.32 | 20.4% |
| 10 | Men's Fashion | 6.55 | 3.3% | 1,479 | 44.32 | 7.8% |
Home & Living Dominates
- 🔥 GMV reached R$ 52.18 billion, accounting for 26.6% of total site GMV, 3.7 times that of second-place Beauty & Health
- Sales volume reached 155.36 million orders, accounting for 32.8% of Top 10 category total sales
- Average price R$ 33.59, belongs to mid-price range
- Cross-border seller share only 6.9%, indicating local sellers dominate this category, with significant room for cross-border sellers to enter
Beauty & Health and Home Appliances Running Neck and Neck
- Beauty & Health GMV 13.97 billion (7.1%), sales volume 75.04 million orders, average price R$ 18.61
- Home Appliances GMV 12.90 billion (6.6%), sales volume 17.28 million orders, average price R$ 74.66
- Home Appliances unit price is 4 times that of Beauty & Health, showing market potential for high-value products
- Beauty & Health cross-border share 16.7%, Home Appliances only 4.2%, reflecting different cross-border penetration rates across categories
Fashion Categories Perform Steadily
- Women's Fashion GMV 12.45 billion (6.3%), sales volume 30.53 million orders, average price R$ 40.77
- Men's Fashion GMV 6.55 billion (3.3%), sales volume 14.79 million orders, average price R$ 44.32
- Fashion Accessories GMV 7.67 billion (3.9%), sales volume 89.59 million orders, average price R$ 8.56
- 📊 Three fashion categories combined GMV 26.67 billion, accounting for 13.6% of total site, showing overall scale of fashion market
- Fashion Accessories has highest sales volume but lowest average price, belongs to high-frequency low-price consumer category
Sports & Outdoors and Mother & Baby Show Strong Growth
- Sports & Outdoors GMV 11.23 billion (5.7%), sales volume 26.90 million orders, average price R$ 41.77
- Mother & Baby GMV 9.62 billion (4.9%), sales volume 22.58 million orders, average price R$ 42.60
- 📈 Sports & Outdoors product growth rate 40.02%, showing healthy lifestyle trend
- Mother & Baby category growth rate 28.61%, influenced by Brazil's demographic structure, market demand remains stable
Digital Categories Show Significant Cross-border Opportunities
- Mobile & Tablet Accessories GMV 9.70 billion (4.9%), cross-border seller share 19.3%
- Audio & Entertainment GMV 7.11 billion (3.6%), cross-border seller share 20.4%
- 💎 Digital categories all have cross-border share exceeding 19%, highest cross-border seller penetration rate among all categories
- Audio & Entertainment average price R$ 33.32, Mobile & Tablet average price R$ 58.21, belong to mid-to-high unit price categories
PART 2 Category Growth Rate Analysis
2025 Category Product Growth Rate Rankings
| Category | Product Growth Rate (%) | Growth Characteristic |
|---|---|---|
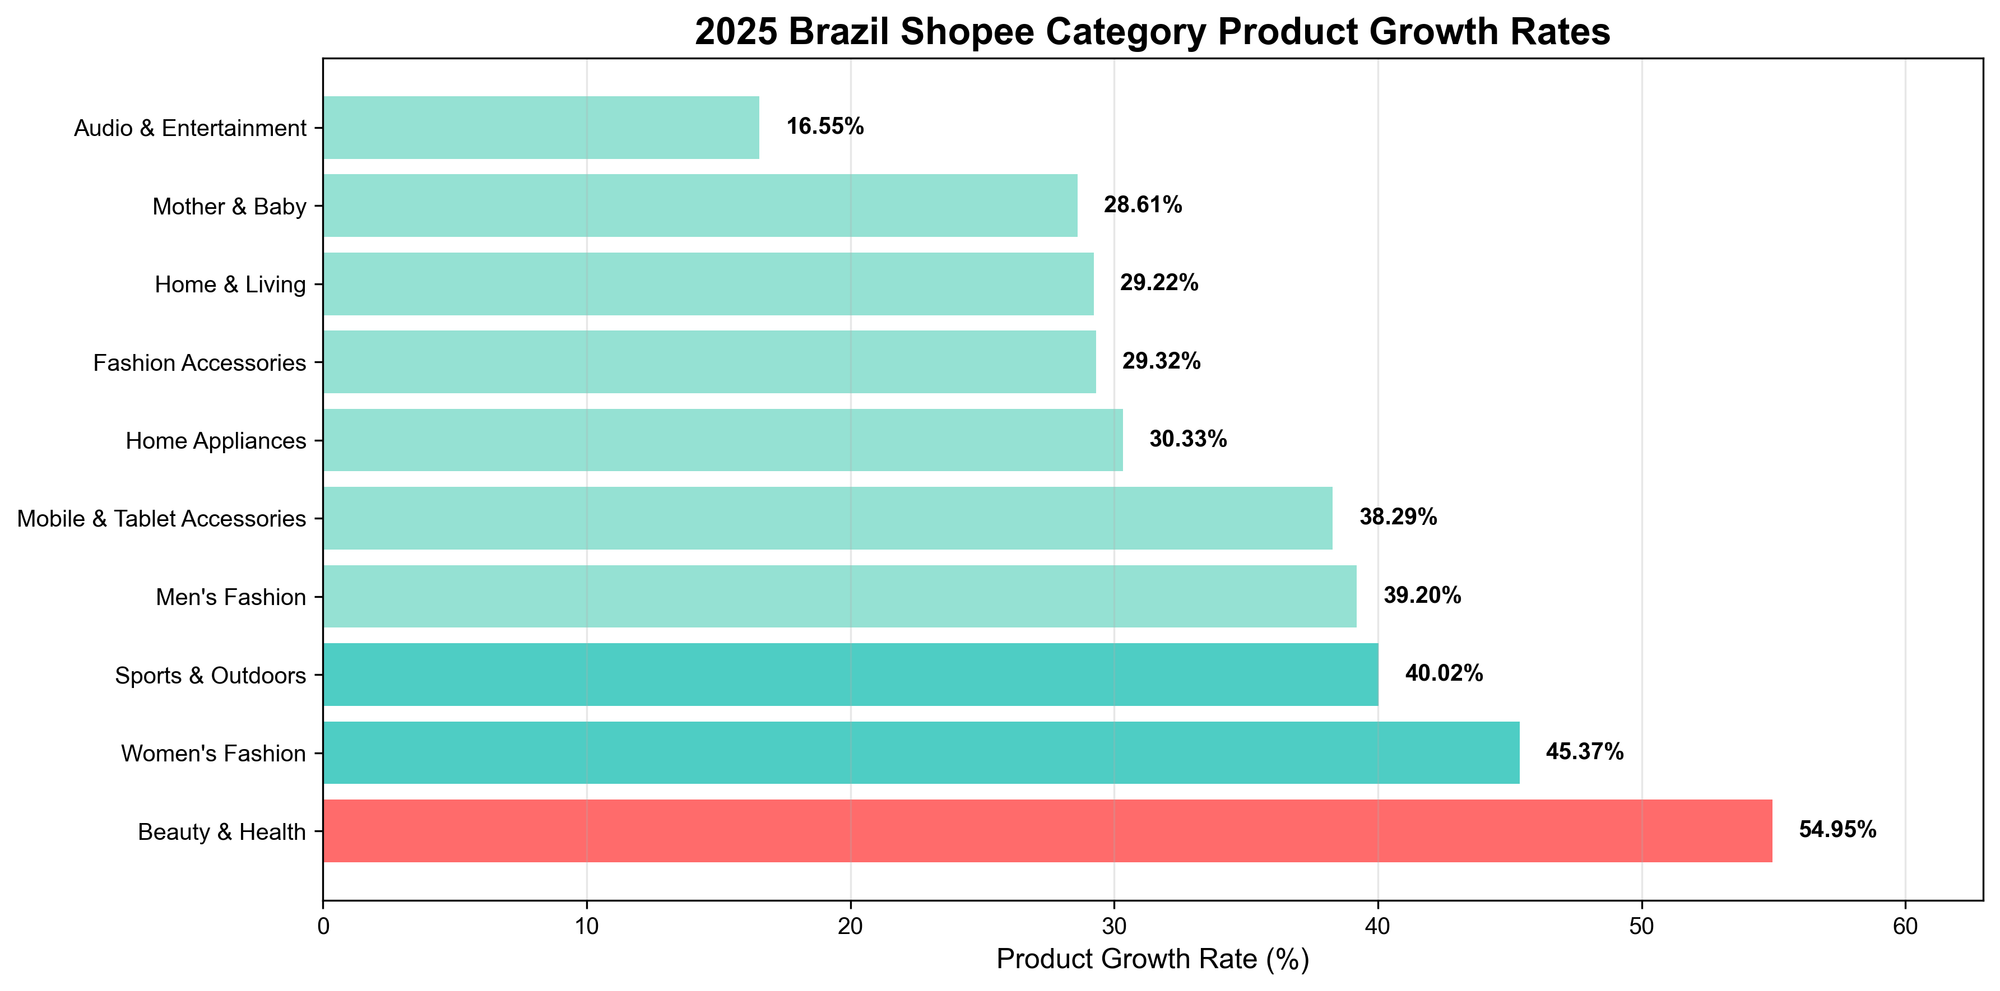
| Beauty & Health | 54.95 | 🔥 Fastest Growth |
| Women's Fashion | 45.37 | 📈 High-Speed Growth |
| Sports & Outdoors | 40.02 | 📈 High-Speed Growth |
| Men's Fashion | 39.20 | Steady Growth |
| Mobile & Tablet Accessories | 38.29 | Steady Growth |
| Home Appliances | 30.33 | Steady Growth |
| Fashion Accessories | 29.32 | Steady Growth |
| Home & Living | 29.22 | Steady Growth |
| Mother & Baby | 28.61 | Steady Growth |
| Audio & Entertainment | 16.55 | Steady Growth |
Beauty & Health Leads Growth
- 🔥 Product growth rate 54.95%, far exceeding other categories
- Fast new product listing speed, high market activity
- Cross-border seller share 16.7%, still significant room for entry
- GMV share 7.1%, growth potential and market scale coexist
Fashion Categories Fully Exploding
- Women's Fashion and Men's Fashion growth rates both exceed 39%, showing strong fashion market demand
- Women's Fashion growth rate 45.37%, second only to Beauty & Health
- Fashion categories overall maintain high-speed growth momentum
Traditional Large Categories Show Steady Growth
- Home & Living, although having highest GMV share (26.6%), has relatively moderate growth rate of 29.22%
- Large categories with high base, relatively stable growth rate is normal phenomenon
- Home Appliances growth rate 30.33%, performs well among high unit price categories
03 Price Band Market Analysis
PART 1 Site-wide Price Distribution Data
2025 Brazil Site Price Band Analysis
⚠️ Note: Price band analysis based on 11 months of product data (missing May data), differs from category data (12 months)
| Price Range (R$) | Product Count | Sales Volume (10K Orders) | Sales Volume Share | GMV (Billion BRL) | GMV Share |
|---|---|---|---|---|---|
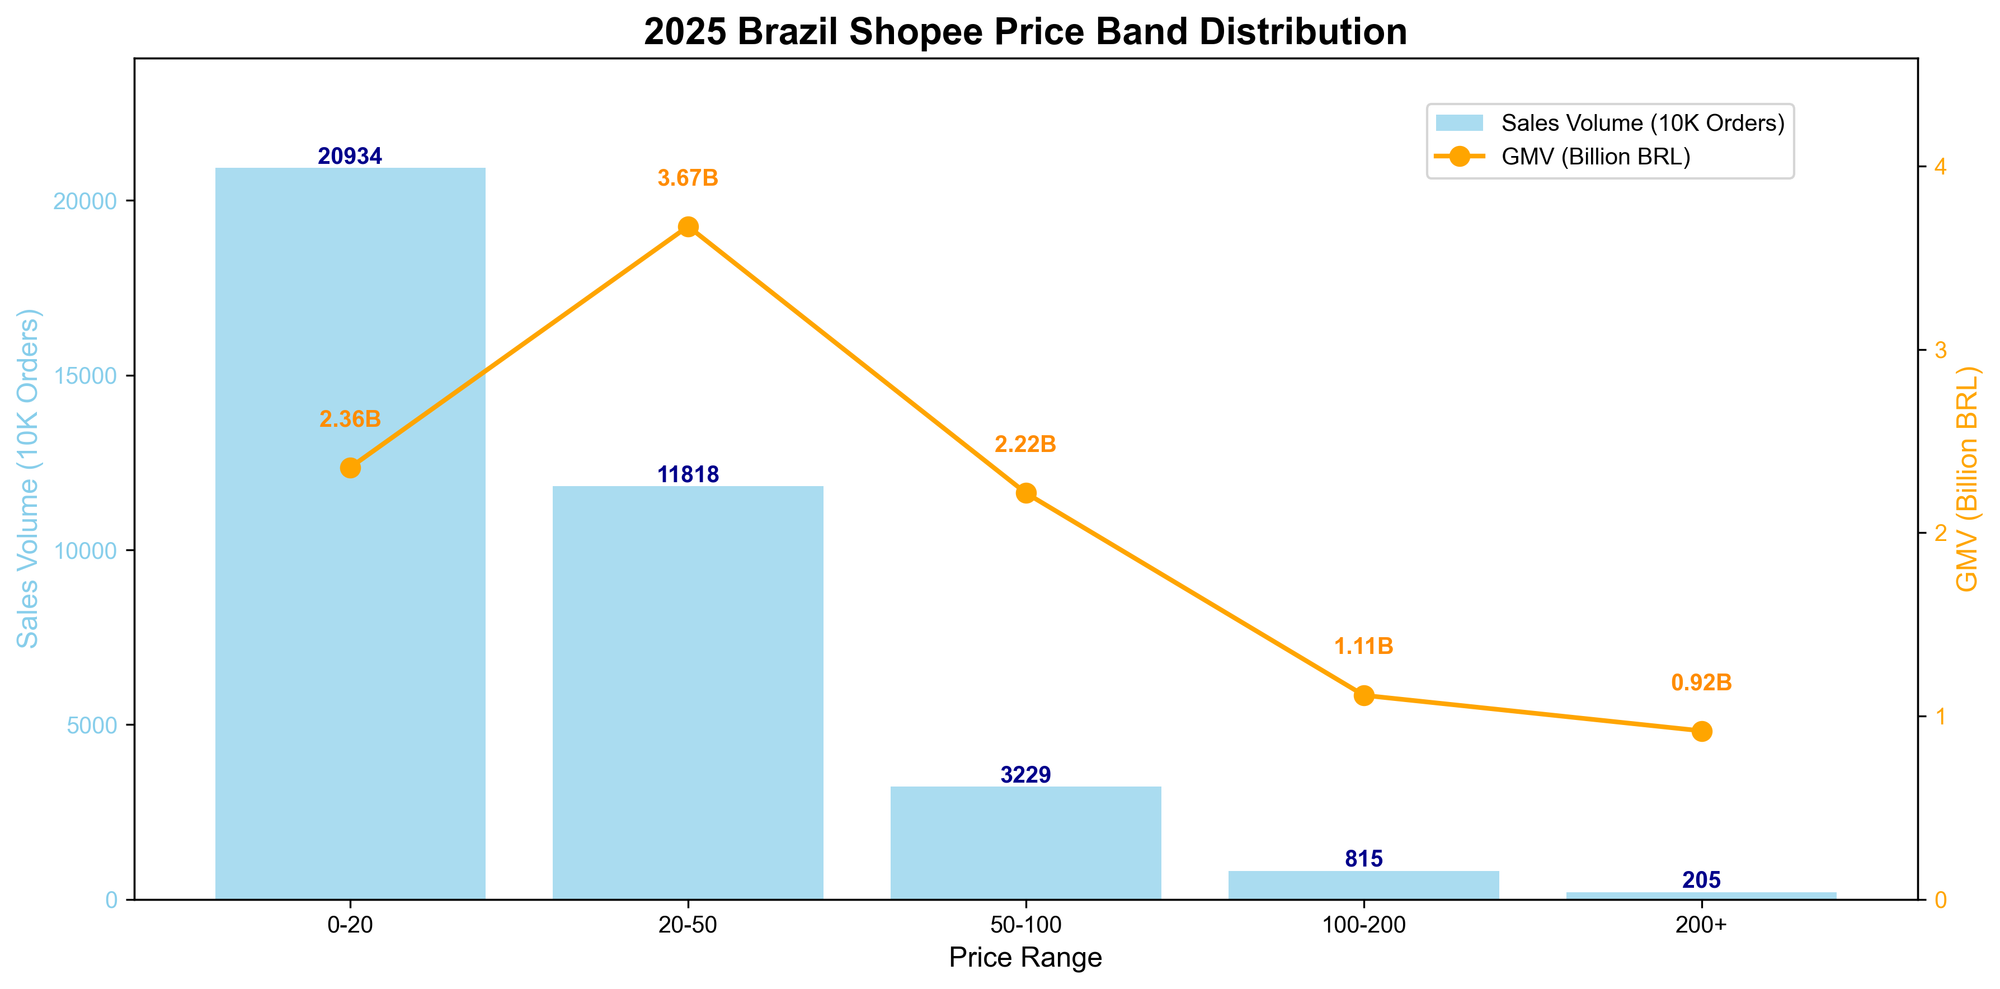
| 0-20 | 60,328 | 20,934 | 56.6% | 2.356 | 22.9% |
| 20-50 | 71,205 | 11,818 | 31.9% | 3.671 | 35.7% |
| 50-100 | 24,166 | 3,229 | 8.7% | 2.216 | 21.6% |
| 100-200 | 7,011 | 815 | 2.2% | 1.113 | 10.8% |
| 200+ | 2,253 | 205 | 0.6% | 0.919 | 8.9% |
Key Findings:
R$ 20-50 is the Golden Price Range
- 🎯 GMV share 35.7%, the largest contributing price range
- Sales volume share 31.9%, ranks second
- Product count 71,205, competition relatively moderate
- 💰 This price range balances sales volume and unit price, the optimal cost-performance range
R$ 0-20 is the Sales Champion
- 🔥 Sales volume share 56.6%, exceeds half of total site sales
- Product count 60,328, low-price market is active
- GMV share 22.9%, although sales volume is high, unit price is relatively low
- Suitable for volume-driven product strategy, but need to pay attention to profit margins
High-Price Market Shows Stable Development
- R$ 100-200 price range GMV share 10.8%, sales volume share 2.2%
- R$ 200+ price range GMV share 8.9%, sales volume share 0.6%
- 💎 High-price market total GMV share 19.7%, close to one-fifth
- High unit price products, although sales volume is low, GMV contribution is stable
Mid-Price Market Shows Balanced Performance
- R$ 50-100 price range GMV share 21.6%, sales volume share 8.7%
- Product count 24,166, market scale is moderate
- Suitable for mid-to-high-end product positioning
- Unit price and profit margin balance is good
PART 2 Price Band Strategy Recommendations
Market Characteristics of Different Price Bands
R$ 20-50 (Golden Price Range)
- Suitable for: Apparel, beauty products, small appliances, sports goods, daily necessities
- Advantages: Highest GMV share (35.7%), optimal balance between sales volume and profit
- Challenges: Requires good product quality and brand image
- Strategy: Focus deployment, create bestsellers, this is the optimal cost-performance range
R$ 0-20 (High-Frequency Consumption Range)
- Suitable for: Accessories, small home items, small beauty products
- Advantages: Largest sales volume (56.6%), fast turnover
- Challenges: Intense competition, lower profit margins
- Strategy: Reduce costs through economies of scale, increase repurchase rate
R$ 50-100 (Mid-Range Market)
- Suitable for: Apparel, beauty products, small appliances, sports goods
- Advantages: GMV share 21.6%, good balance between unit price and profit margin
- Challenges: Requires good product quality and brand image
- Strategy: Differentiated competition, build mid-to-high-end product lines
R$ 100-200 (Mid-to-High-End Market)
- Suitable for: Home appliances, digital accessories, high-end apparel
- Advantages: GMV share 10.8%, large profit margin, high customer quality
- Challenges: High requirements for product quality and service
- Strategy: Strengthen brand value, provide quality service
R$ 200+ (High-End Market)
- Suitable for: Large appliances, high-end digital products, furniture
- Advantages: GMV share 8.9%, high profit per transaction, relatively low return rate
- Challenges: Long decision cycle, requires strong trust endorsement
- Strategy: Provide detailed product information, improve after-sales service
04 Seasonal Trend Analysis
PART 1 Annual Sales Fluctuation Characteristics
Quarterly Sales Comparison
| Quarter | GMV (Billion BRL) | Share | Average Monthly GMV | Characteristics |
|---|---|---|---|---|
| Q1 (Jan-Mar) | 41.33 | 21.1% | 13.78 | Stable Start |
| Q2 (Apr-Jun) | 46.17 | 23.5% | 15.39 | Steady Growth |
| Q3 (Jul-Sep) | 38.22 | 19.5% | 12.74 | Dramatic Fluctuation |
| Q4 (Oct-Dec) | 70.55 | 35.9% | 23.52 | Explosive Growth |
Key Findings:
Q4 is the Annual Sales Peak
- 🔥 Q4 accounts for 35.9% of annual GMV, over one-third
- Average monthly GMV reaches 23.52 billion, 1.8 times that of Q3
- November GMV 22.96 billion, December GMV 26.59 billion, two consecutive months hitting new highs
- Christmas and Black Friday drive sales explosion
August is the Annual Trough
- 📉 August GMV only 8.61 billion, down 40.1% MoM
- Order volume 18.97 million orders, the lowest of the year
- But unit price R$ 45.41, actually one of the highest levels of the year
- Shows that although August has fewer orders, purchased products have higher unit prices
September Shows Strong Rebound
- ⚡ September GMV grew 76.9% MoM, the largest increase of the year
- Jumped from 8.61 billion in August to 15.23 billion
- Order volume increased from 18.97 million to 40.92 million orders
- Shows strong market recovery capability after the trough
Unit Price Shows Seasonal Patterns
- 📊 January-August unit price maintained in R$ 39.75-45.41 range, relatively stable
- Unit price began declining from September: September R$ 37.22, October R$ 29.09, November R$ 21.79, December R$ 15.37
- Q4 unit price decline related to promotional activities and surge in order volume
- December unit price R$ 15.37, lowest of the year, but highest order volume
PART 2 Monthly Sales Characteristics Deep Analysis
First Half (Jan-Jun): Steady with Growth
- January started well, GMV 14.65 billion
- February affected by fewer working days, GMV down 14.6%
- March-April consecutive growth, April reached 15.93 billion
- May-June slight decline, but overall maintained in 14-16 billion range
- Unit price stable in R$ 39.75-43.65 range
Second Half (Jul-Dec): First Decline Then Rise
- July GMV 14.38 billion, down 1.5% MoM
- 📉 August dropped sharply to 8.61 billion, down 40.1% MoM
- ⚡ September strong rebound to 15.23 billion, up 76.9% MoM
- 🔥 October-December continued growth: October 21.00 billion, November 22.96 billion, December 26.59 billion
- Q4 three months combined GMV 70.55 billion, accounting for 35.9% of annual total
PART 3 Inventory and Operations Recommendations
Off-Season Strategy (Jul-Aug)
- July-August is the slowest period of the year, August GMV only 32.4% of December
- Recommendation: Control inventory, avoid excessive stocking
- Can use off-season to test new products, reduce trial-and-error costs
- Focus on high unit price products, August unit price relatively high (R$ 45.41)
- Suitable for store optimization, product adjustment and other preparatory work
Peak Season Strategy (Oct-Dec)
- Q4 order volume accounts for 56.5% of annual total, need to stock up 2-3 months in advance
- October enters peak season, need to ensure sufficient inventory
- November order volume 105.38 million, December order volume 172.96 million, huge logistics pressure
- Recommendation: Communicate with logistics providers in advance, ensure delivery timeliness
- Prepare sufficient customer service staff to handle consultation and after-sales peak
05 Brand and Product Rankings Analysis
PART 1 Brand Market Landscape
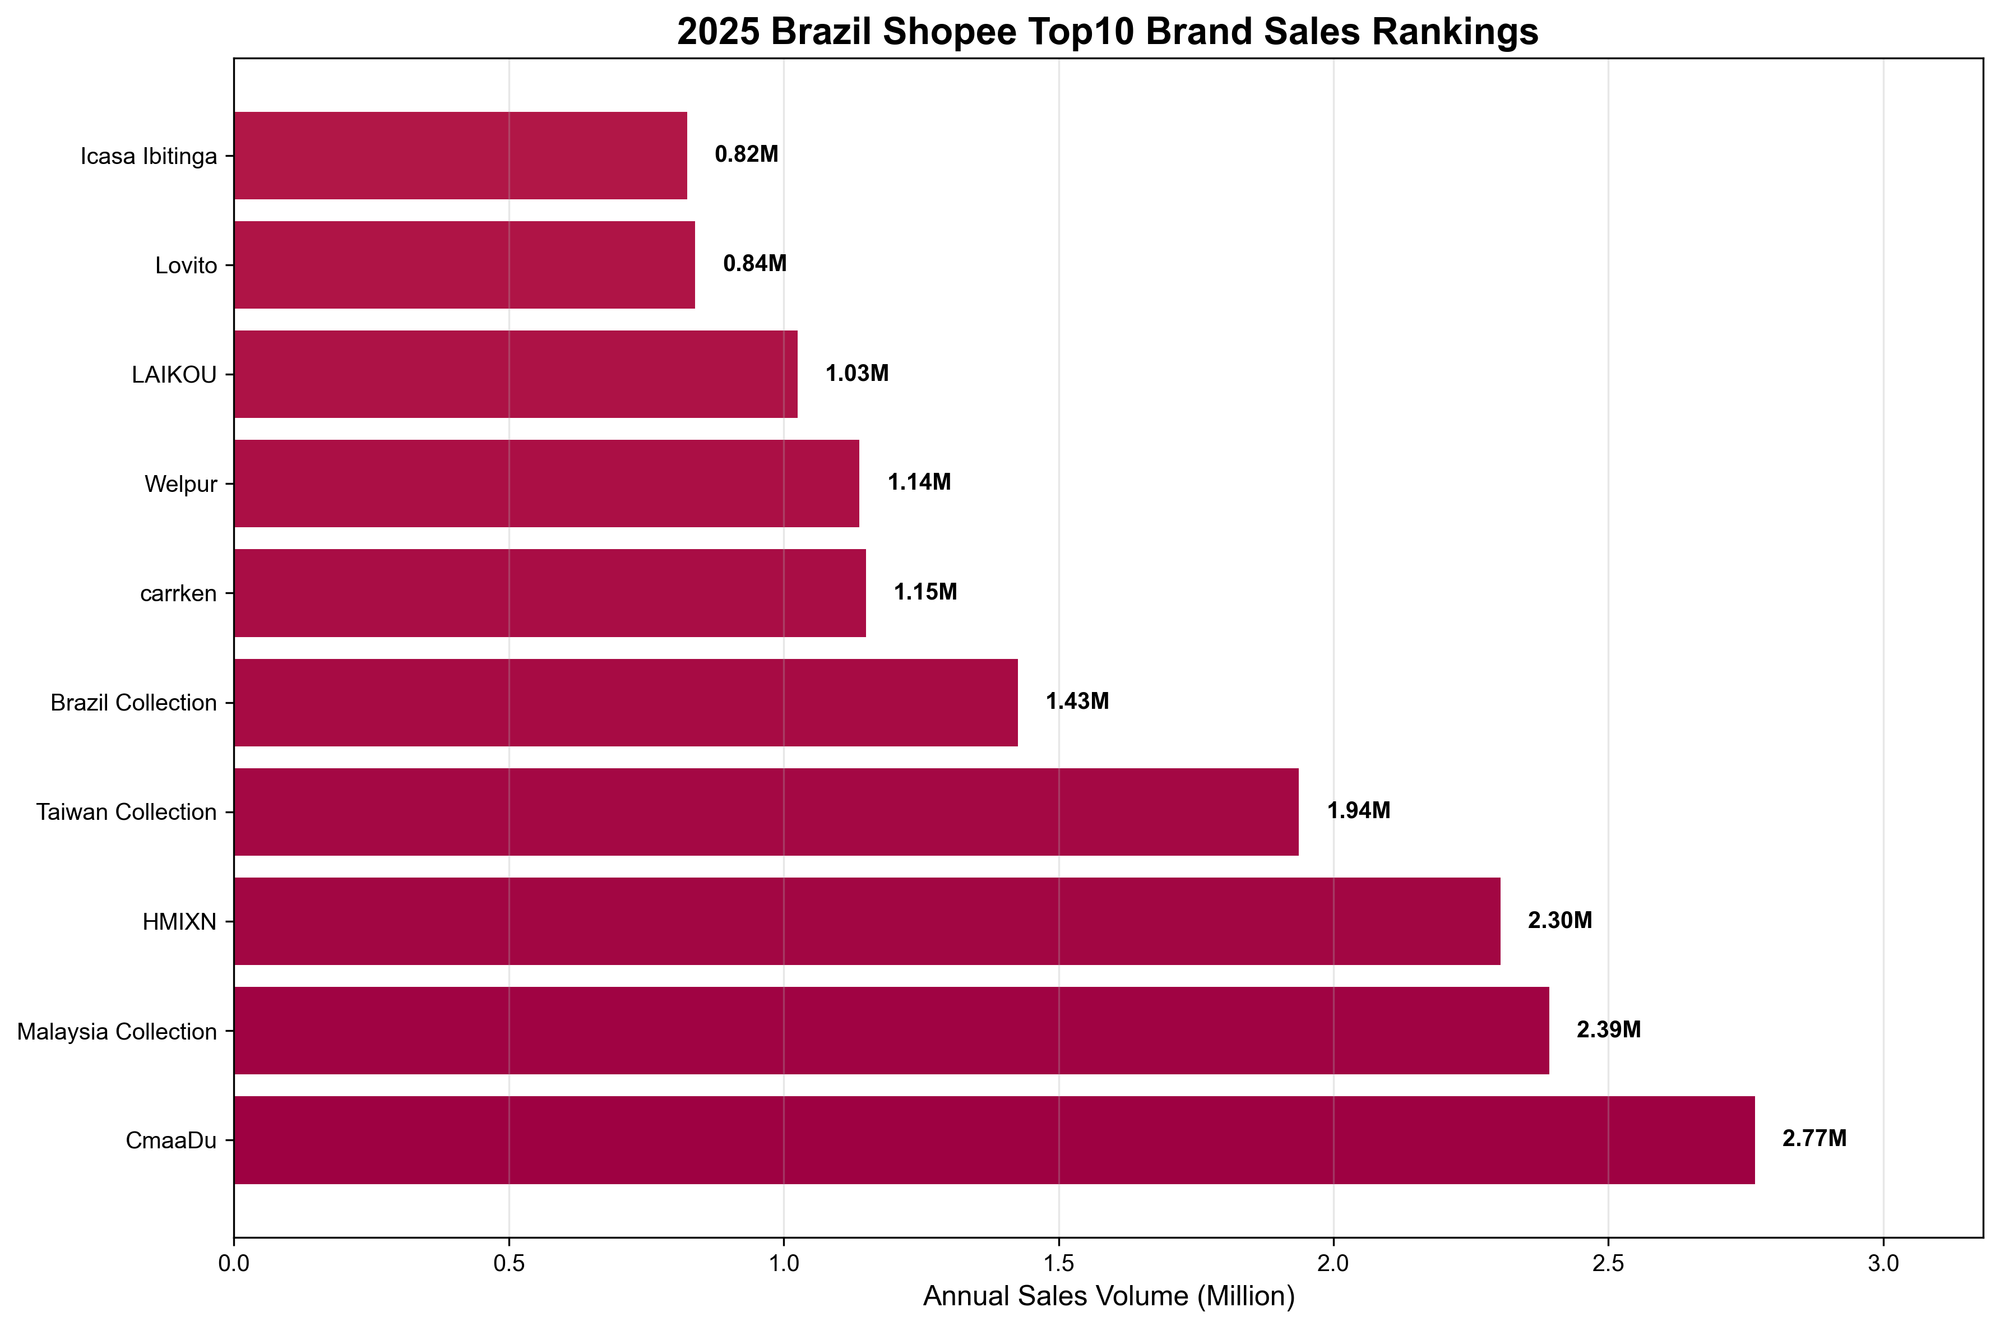
2025 Brazil Site Top 10 Brand Sales Rankings
| Rank | Brand | Annual Sales Volume | Annual Revenue (R$) | Product Count |
|---|---|---|---|---|
| 1 | CmaaDu | 2,767,000 | 13,310,000 | 8 |
| 2 | Malaysia Collection | 2,393,000 | 87,300,000 | 670 |
| 3 | HMIXN | 2,304,000 | 4,340,000 | 11 |
| 4 | Taiwan Collection | 1,937,000 | 59,520,000 | 429 |
| 5 | Brazil Collection | 1,426,000 | 63,130,000 | 264 |
| 6 | carrken | 1,149,000 | 22,830,000 | 9 |
| 7 | Welpur | 1,138,000 | 13,320,000 | 4 |
| 8 | LAIKOU | 1,025,000 | 15,140,000 | 14 |
| 9 | Lovito | 839,000 | 63,150,000 | 115 |
| 10 | Icasa Ibitinga | 824,000 | 19,760,000 | 12 |
Beauty Brands Show Outstanding Performance
- 🔥 CmaaDu ranks first with 2.767 million annual sales, only 8 products created 13.31 million reais in revenue
- LAIKOU, carrken and other beauty brands all entered Top 10, showing brand concentration in beauty category
- Beauty brands generally adopt "few SKUs, high sales volume" strategy, single product bestseller effect is obvious
Collection Series Brands Occupy Important Position
- Malaysia Collection, Taiwan Collection, Brazil Collection three major Collection brands combined sales 5.756 million
- These brands have many products (264-670), covering multiple categories
- Shows that "many SKUs, wide coverage" brand strategy is equally effective
Cross-border Brand Opportunities Are Significant
- Among Top 10 brands, most are cross-border brands or international brands
- Local brand Icasa Ibitinga (home textile brand) entered Top 10, showing local brand advantages in specific categories
- Cross-border sellers can gain higher market share through branded operations
PART 2 Best-selling Product Analysis
Site-wide Top 20 Best-selling Product Characteristics
Based on full-year 2025 data, site-wide Top 20 best-selling products show the following characteristics:
Product Type Distribution
- 🎯 Beauty & Health: Occupies 6 spots, including foundation, eyebrow pencils, lip gloss and other makeup products
- 👓 Fashion Accessories: Occupies 7 spots, including sunglasses, jewelry, bags, etc.
- ⌚ Watches: Occupies 4 spots, showing strong demand for watches in Brazil market
- 🎧 Audio & Entertainment: TWS Bluetooth earphones entered Top 3, annual sales 1.769 million
- 🏠 Home & Living: LED light strips and other smart home products perform well
Price Characteristics
- Average price concentrated in R$ 8-16 range, belongs to low-price high-frequency consumer goods
- Highest sales volume product (beauty foundation) average price only R$ 8.12, annual sales 2.35 million
- High-price products (R$ 20+) also entered Top 20 through high sales volume
Brand Characteristics
- Most products are unbranded (white label) products
- Few branded products like CmaaDu lip gloss, HMIXN jewelry entered Top 20
- Shows that in low-price market, product itself is more important than brand
PART 3 Key Category Product Rankings
Mother & Baby Category Top 10 Product Analysis
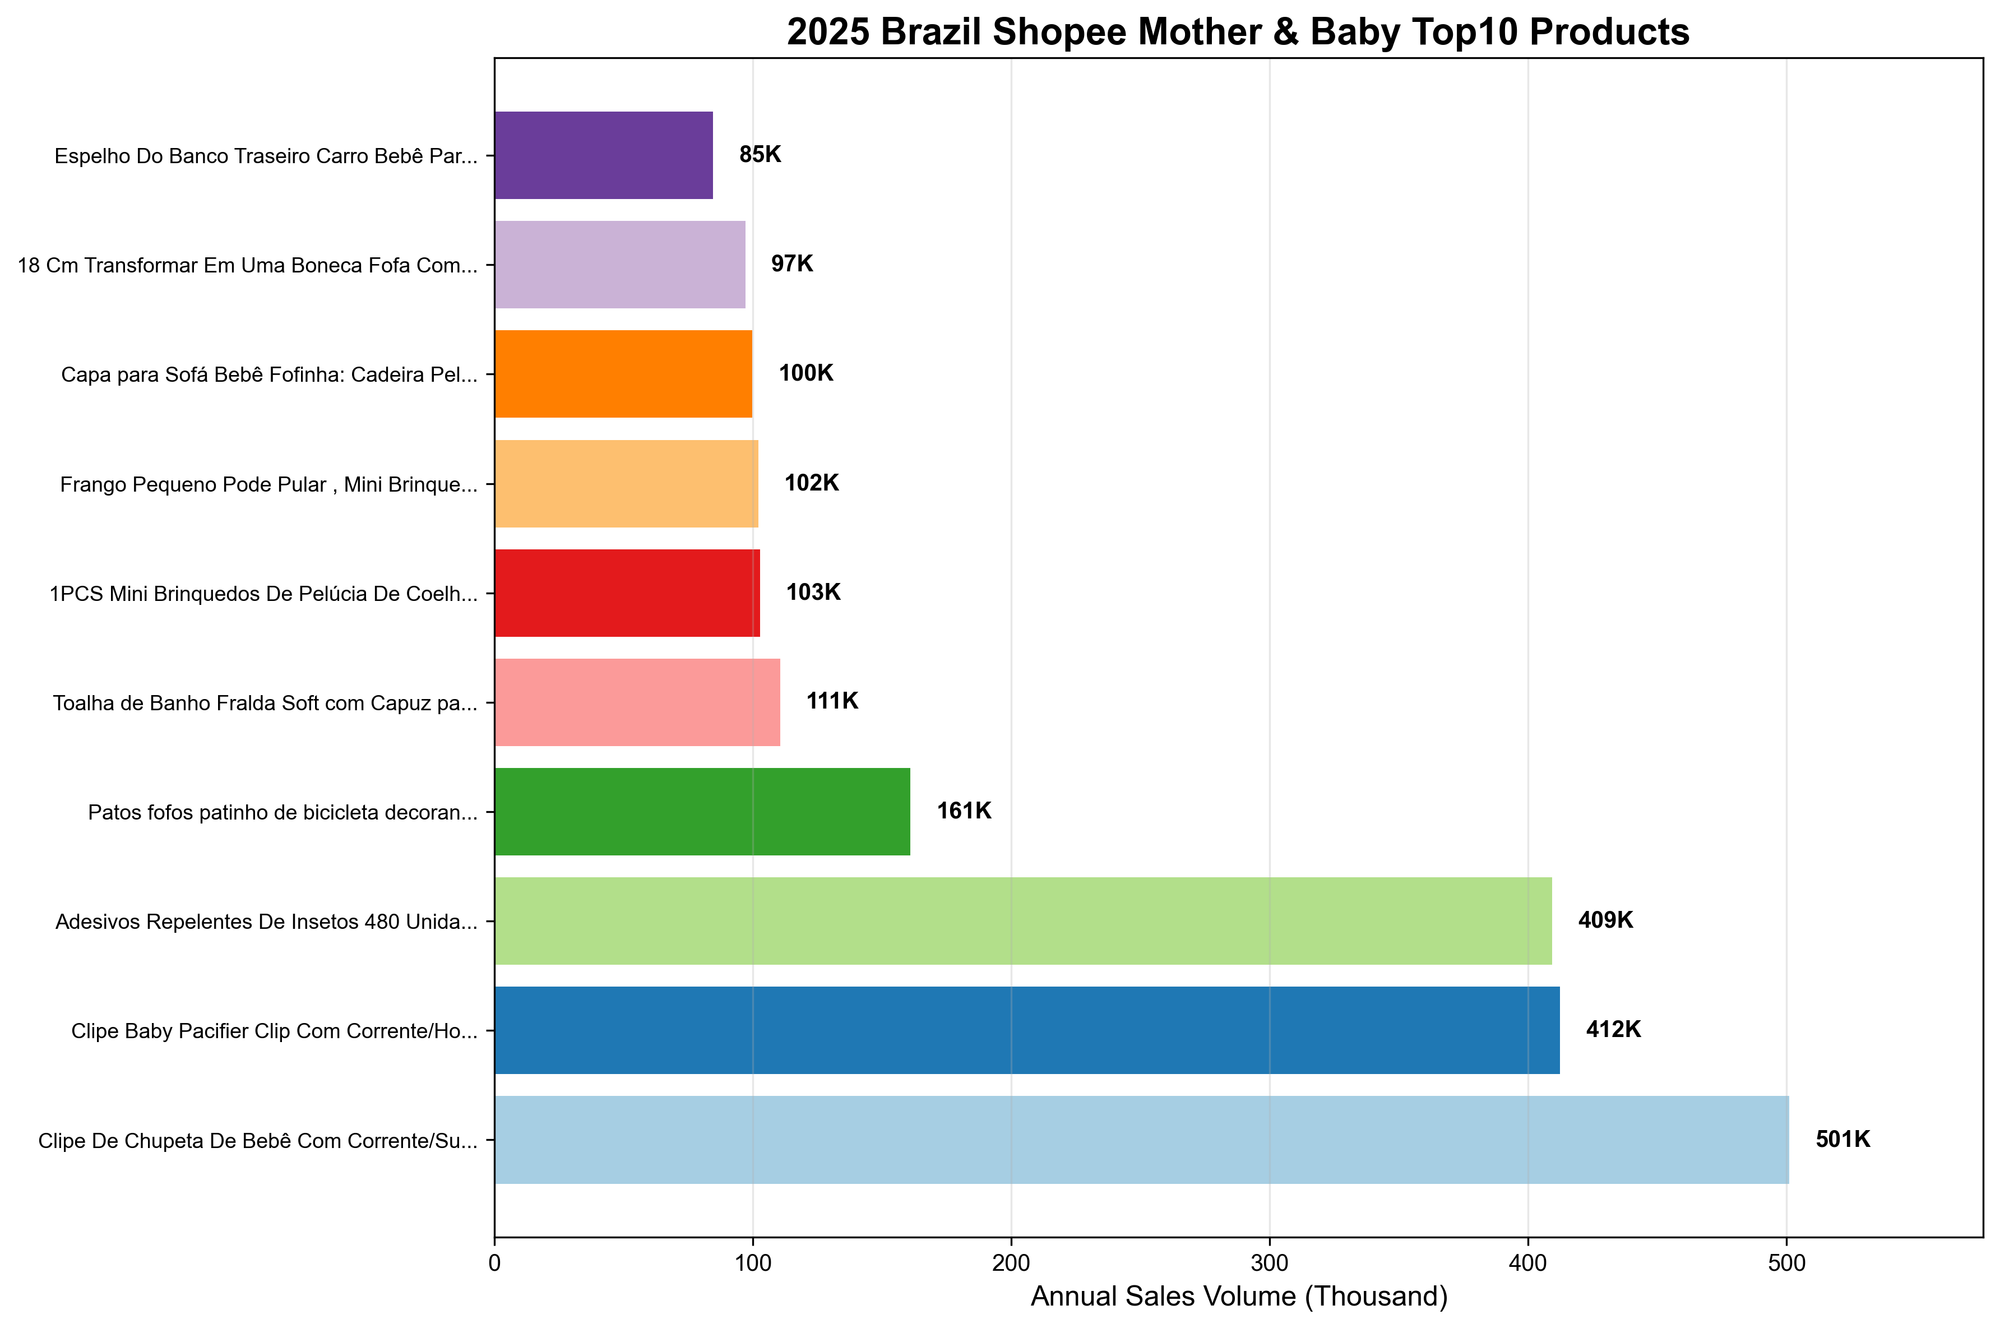
Mother & Baby category as a high-growth category (growth rate 28.61%), its best-selling products show the following characteristics:
Product Types
- 🍼 Baby Products: Pacifier clips, pacifier chains and other small items occupy top 2 spots, annual sales 501,000 and 412,000 respectively
- 🦟 Mosquito Repellent Products: Mosquito repellent patches annual sales 409,000, showing strong demand for baby protection products in Brazil market
- 🧸 Toy Decorations: Small duck decorations, plush toys and other products perform well
- 🛁 Bath Products: Hooded bath towels and other practical products entered Top 10
Price Characteristics
- Price range: R$ 1.69 - R$ 51.35
- Mainstream price: R$ 3-6, belongs to high-frequency low-price consumer goods
- High-price products (R$ 29+): Branded products like Papi bath towels, baby sofa covers, showing high-end market opportunities
Seller Source
- 90% are cross-border sellers, only 1 local brand Papi entered Top 10
- Cross-border sellers have price advantage in mother & baby small items
Beauty & Health Category Top 10 Product Analysis
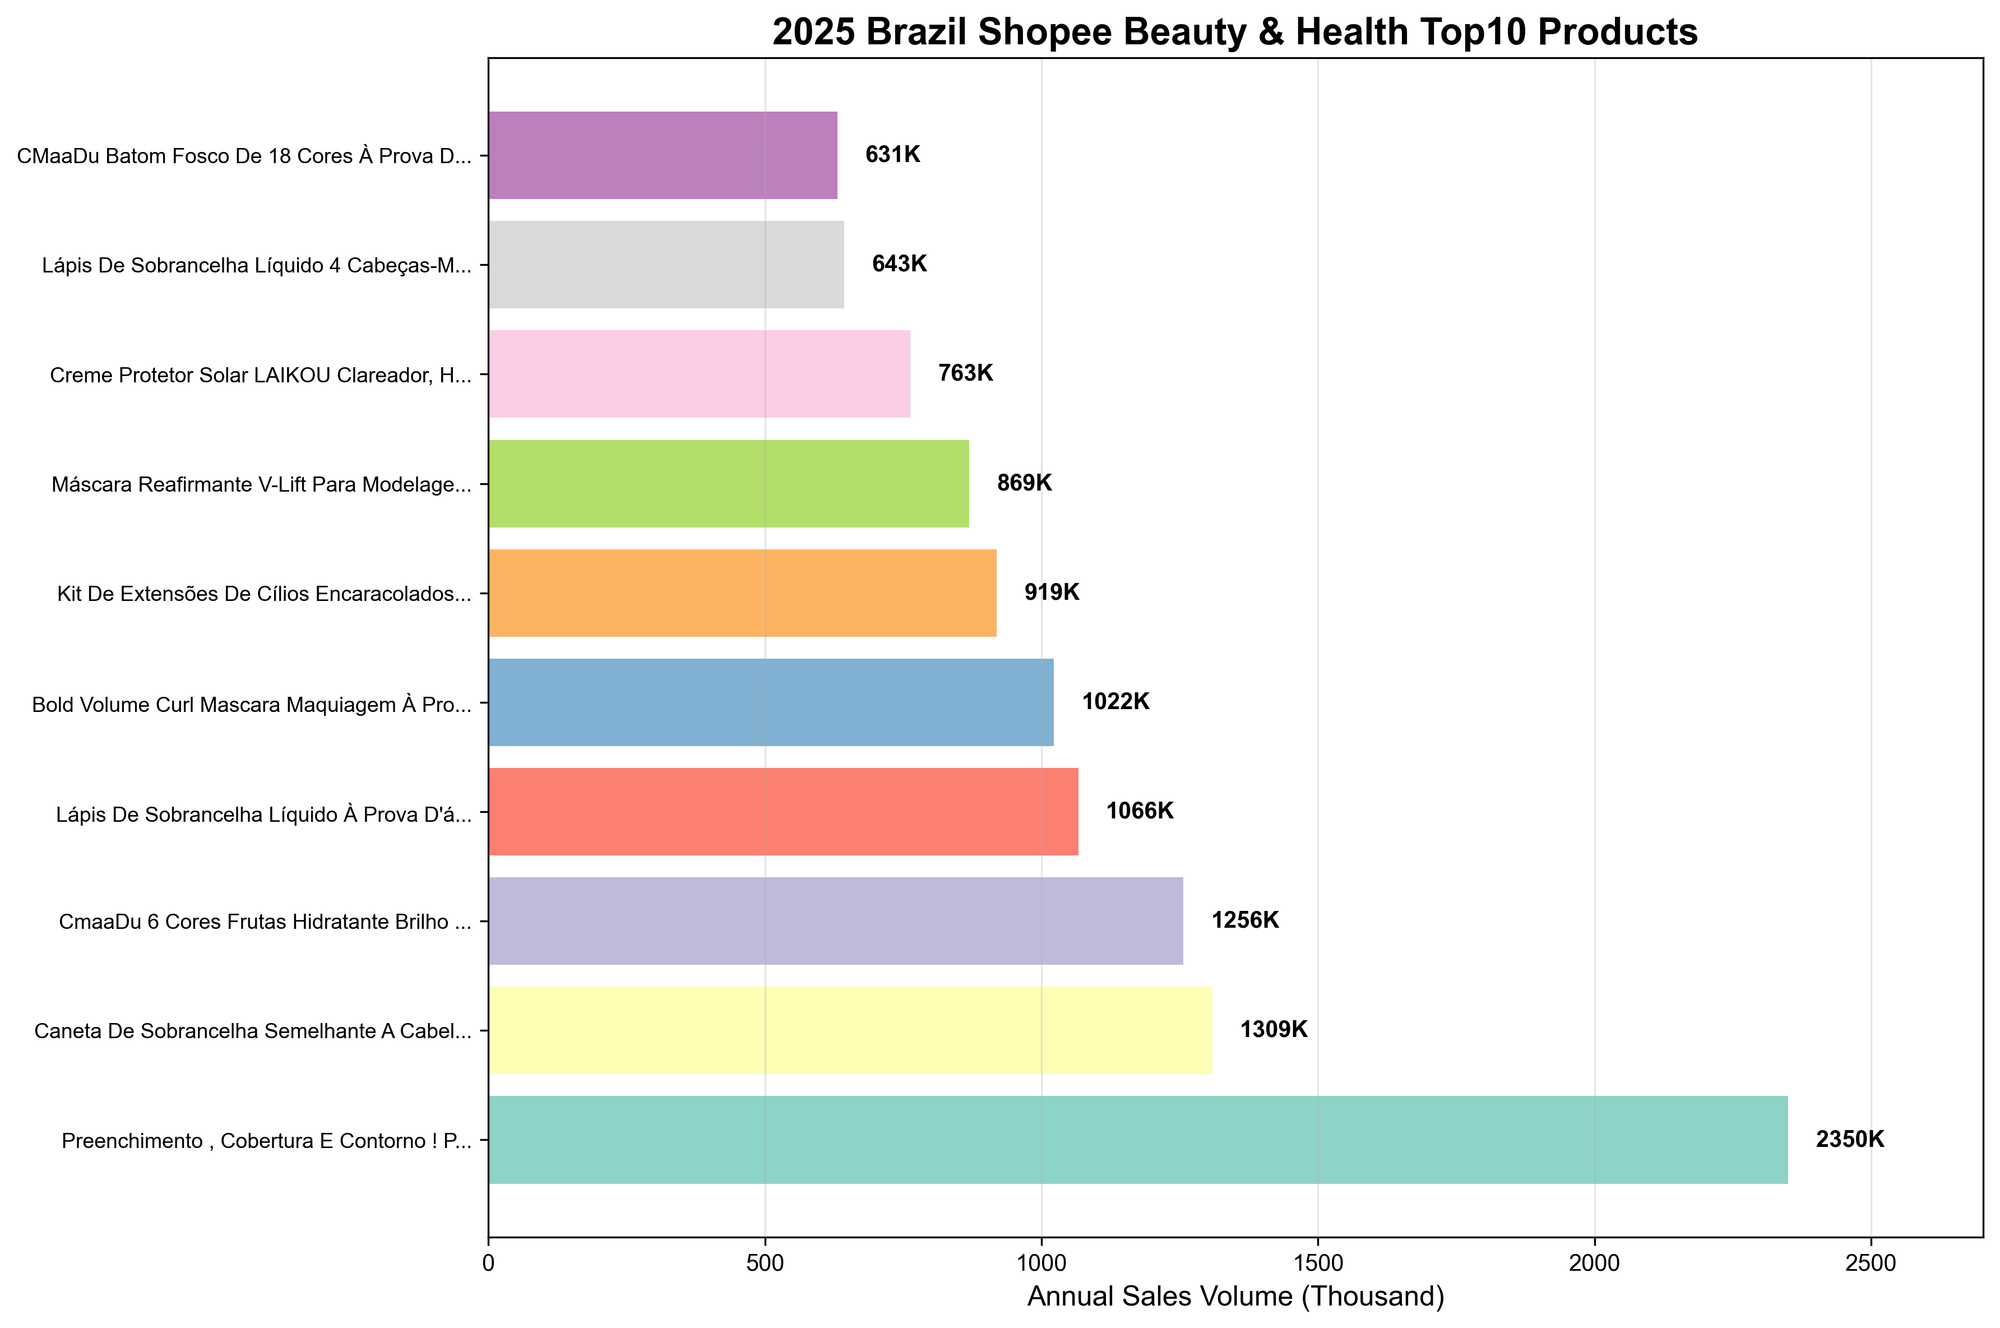
Beauty & Health as the fastest-growing category (growth rate 54.95%), its best-selling product characteristics:
Product Types
- 💄 Makeup Products: Foundation, eyebrow pencils, lip gloss occupy top 3 spots, combined annual sales exceed 4.6 million
- 🧴 Skincare Products: Face masks, serums and other basic skincare products perform well
- 💅 Nail Products: Nail polish, nail tools entered Top 10
Price Characteristics
- Extremely low prices: R$ 4-12 is the mainstream price range
- Foundation product average price R$ 8.12, annual sales 2.35 million, is the site's sales champion
- Low-price strategy is extremely effective in beauty category
Brand Characteristics
- CmaaDu brand occupies 3 spots, showing brand importance in beauty category
- Unbranded products also perform well, showing product quality and cost-performance are key
06 Data Summary and Market Insights
PART 1 Core Data Review
2025 Brazil Shopee Site Key Metrics
| Metric | Data | Description |
|---|---|---|
| Annual GMV | R$ 19.628 billion | Market size continues to expand |
| Annual Order Volume | 549.55 million orders | Order volume exceeds 540 million |
| Average Order Value | R$ 35.71 | Mid-range price is mainstream |
| Largest Category | Home & Living | GMV share 26.6% |
| Fastest Growing Category | Beauty & Health | Product growth rate 54.95% |
| Best Price Range | R$ 20-50 | GMV share 35.7% |
| Peak Sales Month | December | GMV reaches 26.59 billion |
| Lowest Sales Month | August | GMV only 8.61 billion |
PART 2 Market Opportunity Insights
Category Opportunity Analysis
High-Growth Categories (Growth Rate >40%)
- 🔥 Beauty & Health: Growth rate 54.95%, cross-border share 16.7%, still room for entry
- Recommended products: Skincare products, makeup, personal care items
- Price recommendation: R$ 20-80
- Key success factors: Product quality, brand image, user reviews
- 📈 Women's Fashion: Growth rate 45.37%, GMV share 6.3%, strong market demand
- Recommended products: Dresses, T-shirts, casual wear
- Price recommendation: R$ 30-60
- Key success factors: Novel styles, complete sizes, fast new arrivals
- 💪 Sports & Outdoors: Growth rate 40.02%, cross-border share 14.4%
- Recommended products: Sports apparel, fitness equipment, outdoor gear
- Price recommendation: R$ 40-120
- Key success factors: Functionality, cost-performance, brand recognition
Large-Scale Categories (GMV Share >5%)
- 🏠 Home & Living: GMV share 26.6%, largest market scale
- Cross-border share only 6.9%, local sellers dominate, but still opportunities
- Recommended products: Storage items, kitchen supplies, home decorations
- Price recommendation: R$ 25-80
- Key success factors: Practicality, design sense, cost-performance
- ⚡ Home Appliances: GMV share 6.6%, average price R$ 74.66
- High unit price category, large profit margin
- Recommended products: Small appliances, kitchen appliances, personal care appliances
- Price recommendation: R$ 60-200
- Key success factors: Quality assurance, after-sales service, brand trust
Cross-border Advantage Categories (Cross-border Share >15%)
- 📱 Audio & Entertainment: Cross-border share 20.4%, highest
- Recommended products: Earphones, speakers, gaming accessories
- Price recommendation: R$ 30-100
- 📲 Mobile & Tablet Accessories: Cross-border share 19.3%
- Recommended products: Phone cases, chargers, data cables, screen protectors
- Price recommendation: R$ 20-80
- 💄 Fashion Accessories: Cross-border share 17.2%, highest sales volume
- Recommended products: Jewelry, bags, sunglasses, watches
- Price recommendation: R$ 10-50
Price Strategy Recommendations
New Seller Strategy
- Recommended price range: R$ 20-50
- Advantages: Highest GMV share (35.7%), large sales volume, high market acceptance, low trial-and-error cost
- Recommended categories: Fashion Accessories, daily necessities, Beauty & Health
- Considerations: Intense competition, need to win through differentiation and cost-performance
Mature Seller Strategy
- Recommended price range: R$ 50-100
- Advantages: Balance between sales volume and profit, GMV share 21.6%, suitable for mid-to-high-end product positioning
- Recommended categories: Apparel, small appliances, Sports & Outdoors, Beauty & Health
- Considerations: Requires good product quality and brand image
High-End Market Strategy
- Recommended price range: R$ 100-200+
- Advantages: Large profit margin, high customer quality
- Recommended categories: Home appliances, high-end digital products, furniture
- Considerations: Requires strong brand endorsement and comprehensive after-sales service
Seasonal Strategy Summary
Q1 Strategy (Jan-Mar)
- Market characteristics: Stable start, slight decline in February
- Inventory recommendation: Normal inventory levels
- Promotional events: Valentine's Day (February 14), Women's Day (March 8)
- Recommended categories: Gifts, beauty products, apparel
Q2 Strategy (Apr-Jun)
- Market characteristics: Steady growth, average monthly GMV 15.39 billion
- Inventory recommendation: Maintain sufficient inventory
- Promotional events: Mother's Day (second Sunday of May), Children's Day (June 12)
- Recommended categories: Mother & Baby, gifts, home products
Q3 Strategy (Jul-Sep)
- Market characteristics: Dramatic fluctuation, August trough, September rebound
- Inventory recommendation: Control inventory in July-August, start stocking up in September
- Promotional events: September rebound period, suitable for promotions
- Recommended categories: High unit price products (August), all categories (September)
Q4 Strategy (Oct-Dec)
- Market characteristics: Explosive growth, accounts for 35.9% of annual total
- Inventory recommendation: Stock up heavily 2-3 months in advance
- Promotional events: Black Friday (November), Christmas (December)
- Recommended categories: All categories, focus on gifts, electronics, apparel
Shopdora
The Best Shopee analytic tool
Free trial
Report Completion Time: February 2026
Data Support: Shopdora Data Team
Data Update: Based on complete 12-month data from 2025